Tools and resources
We have created a number of professional tools, resources and templates to support your QI journey.
Do you have an idea or have you identified what you want to improve?
You'll just need the right tools to get started. Use the tools and resources you need for each stage of your improvement strategy.
How to get started
If you have any questions, would like a chat about your idea or want to know what support is available from the team, email us ccs.improvementteam@nhs.net
You can capture your Quality Improvement initiative using our QI Snapshot template. Send it to the Improvement and Transformation team to share your learning and help us track our QI journey.
-
1520Kb
Tools for creative thinking
These tools can help with idea generation and choosing which changes to move forward with.
Generate new ideas by viewing a situation from different perspectives using this tool.
Extend your understanding of a change of idea by evaluating it from several different perspectives using this tool.
If things are not moving forward as you had hoped this activity can help.
Identify the unwritten rules which exist in your service or area for improvement, and break them up to think creatively about how to generate new solutions.
This tool allows you to rank tasks to remove any confusion about how important they are to help you prioritise.
MoSCoW is an acronym for the prioritisation categories:
M - Must have
S - Should have
C - Could have
W - Won't have
Prioritise changes by plotting the likely impact of a change against the effort it will take to implement.
Understand users' needs when designing a new service, improvement, or change. Use these template personas, or you may be inspired to create your own.
Project documentation
An overview of documents to support your Quality Improvement project from start to finish.
The project charter outlines your project's goals and deliverables, with approval from the appropriate leader or Programme Board for complex projects.
Created at the start of a project, it should be regularly reviewed and updated to keep everyone aligned and avoid duplication of work.
A tool to ensure planned benefits add real value to your service and organisation while assigning responsibility for delivery. Integrated from project start to finish, it tracks progress toward intended benefits.
A tool that sets out the different options to reach your project's objectives. You can also use it to evaluate each option's viability against a set of criteria against each option using an Options Scorecard.
The options include:
- Benefits
- Timescale
- Financial outlay/profit
A helpful tool to allow you to keep track of all the actions that need to be taken throughout the life of the project.
It identifies the different workstreams for the project, who will be doing what and by when. It is red, amber, green (RAG) rated so it is easy to keep an eye on any slippage in timescales.
The lessons learned tool supports regular reflection on what went well and what didn't, capturing insights throughout the project. This log helps guide future projects for you and other teams.
Review achievements, lessons learned, outstanding actions, and recommendations, and develop a schedule for ongoing review. This step is crucial for evolution and continual improvement.
Using data for improvement
Let data drive your improvements. Data is your ultimate tool for pinpointing areas that need change and creating a compelling case for improvement. While it might feel daunting at first, don't let that stop you!
Understand your service's workload with help from the Business and Information Service. Email the Data Request team for more information ccs.datarequests@nhs.net.
Find population trends via Public Health Profiles and local Joint Strategic Needs Assessments (JSNA) Explore how process improvements can make workflows more efficient.
Shift focus from compliance to improvement and compare performance with others to identify opportunities.
Did you know that 80% of the impact can come from 20% effort? Learn how to apply this quality improvement method using our guide.
Using impact measures can help track and measure the success of your improvement initiatives. Choose metrics most aligned with your objectives using our Impact Measures information and explore data sources like Public Health Profiles.
Use our statistical process control guide to monitor and improve processes.
Statistic Process Control document
You can join our Measure Up Masterclass to gain support, sharpen your data and amplify your impact!
Design tools
Design is about making sure that the solution you develop is a good fit for the problem you are trying to solve. There are lots of different angles to think about, from developing efficient processes to designing ideas that work well for all service users.
By using tried and tested techniques, you'll soon have developed your idea from a rough sketch to a work of art!
Some good design principles for an effective design:
- Simplify! Great design makes it easy to do things right. See how many steps you can cut out – you might be surprised!
- Get it right the first time. Sounds easy, right? But so many of our systems rely on repeated actions, like checking work, walking back and forth to a store cupboard, or having multiple appointments.
- Eliminate waste by identifying which steps add value.
- Think about different perspectives. You’ll be amazed by the ideas you can generate by walking in someone else’s shoes.
- Make it inclusive. Get other people involved and reach out to people who might feel excluded.
- Consider human behaviour. In theory, it should be easy to design a perfect process, but then we add people to the mix! Consider how easy and attractive your design is, and what might get in the way of people adopting it.
Identify the gap between where you are at the moment and where you want to be to develop an effective action plan to get you from A to B.
Use characters who are representative of different groups of service users to help develop your design from different perspectives.
You could spend years studying all the different theories about how people respond to change, but who has the time for that?
Don’t worry – we’ve got your back. Summaries of some key ideas:
- Develop a shared picture of what will be better when your proposed change has taken place. Your vision is your guiding star!
- Engage, engage, engage! You might have heard the idea that people need to hear a message 7 times for it to sink in. Our advice would be don’t stop at 7! Change up the ways you share your message and ask for people to get involved.
- Treat people how they want to be treated, not how you would like to be treated. We’re all different – that’s what makes life interesting. People need different things to get excited about change – spend some time working out what makes them tick!
- Recognise and acknowledge emotions. By understanding and accepting where people are, you can help them to move forward.
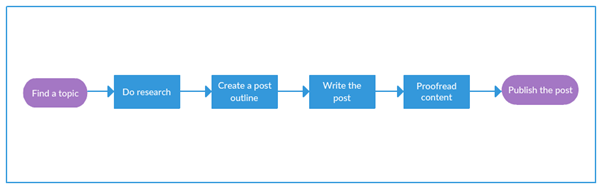
These simple frameworks help us understand the stages people go through to come to terms with change along with ideas to engage people during each phase.
Understand the cycle of feelings people typically experience during change and what to do when someone gets stuck in a particular emotional state.

Understand what makes different people tick and what they need to work at their best.
Identify ways to engage service users in your improvement initiative to make a difference.
Contact your Co-production Lead or the team for tips, support and inspiration.
An easy-to-use tool which helps to clarify roles and responsibilities within a team.
Process improvement
A 'process' is a series of actions which are carried out to achieve a particular result, for example:
- How a service receives and manages referrals
- How letters are written and sent to service users
- How clinic appointments are booked
All our services have a range of clinical and administrative processes in place, often supported by more detailed instructions (‘Standard Operating Procedures’ or ‘SOPs’).
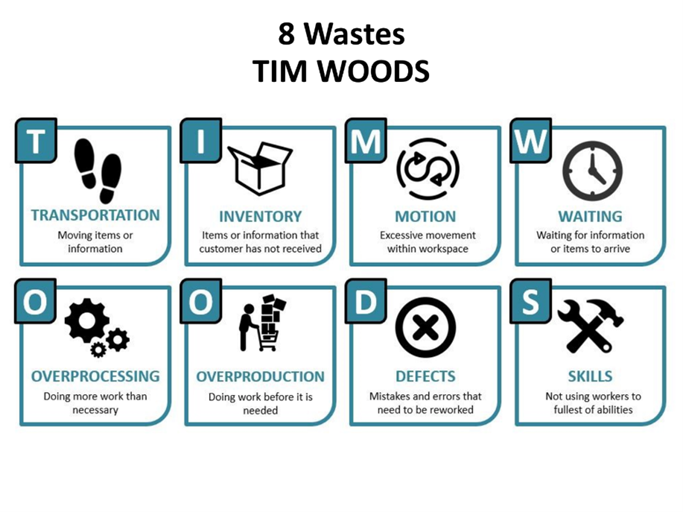
Process improvement is where we review a process because we think things could be done more effectively.
A process map is a diagram putting into visual form the steps of a process. It can be created in a basic flowchart or in more detail (using swimlanes to represent different teams or services).
You may wish to begin process mapping at the start of a project or improvement. It can help you to understand how a process works and what the links are between teams or services. This can be useful in identifying who needs to be involved in the work and what data or other information might be needed.
Traditionally, specific shapes mean certain things on a process map – for example, a diamond usually represents a decision being made.
When reviewing processes, it can be helpful to record the time it takes to complete each step in the process.
Looking at process flow helps:
- understand how a process works in real-time
- identify bottlenecks which delay the flow of a process or pathway
- understand how a change to a process has affected its flow
When you’ve completed the tool it gives you a visual representation of the time and resources needed to complete a process.
A value stream map (VSM) is similar to a process map, in that it displays the steps in a specific process.
VSMs usually:
- go into more detail than process maps
- emphasise which steps in the process add value (to the patient, service user or family)
- include details of the time taken to complete each step and the number of tasks performed at each step
You may decide to use value stream mapping when you need to:
- identify the key roles responsible for the process and how they relate to each other
- highlight how a process flows across team/service boundaries or functions/technology
- identify potential process issues like reworking, duplication, excessive checking etc.
- identify the time taken at each stage and the volume of work going through the process
'TIMWOODS' is an acronym describing how processes can be wasteful – for example, a process which moves things around a lot can be considered to be wasteful in terms of Transportation.
Another example is when colleagues have to queue to use the photocopier – this is wasteful in terms of Waiting.
If you have defined the process you want to put into a process map, take a look at the categories defined in the TIMWOODS tool. Consider whether you are wasting the valuable resources of your team or service in any of the eight ways defined in the tool. You may find that this helps you to improve your process and service provided to patients, service users or families.
Spaghetti diagrams can help highlight how time, money and other resources can be used more effectively.
A spaghetti diagram is a picture using a continuous line to show the physical journey someone or something goes on. It can be particularly useful to understand the experience a patient or service user may have on a clinical pathway, how clinical supplies are managed, or in considering how a referral is processed through the service.